System Monitors
Tools for monitoring system load and program performance.
When we’re running compute workloads, it is often useful to monitor a system’s load, both to see how well we are using the system and to help identify system or program bottlenecks. We want a system monitor that can help us answer several questions:
- How much of my system’s resources (CPU, memory, disk IO, etc.) are in use?
- Which processes are using the most resources?
It’s also nice if the system monitor itself does not consume too many resources.
Linux
I recommend btop if it is installed on your system and you don’t know which one to pick. If btop is not available, htop is a good second choice.
On UNIX-heritage systems, the classic built-in system monitor is top. This is a pretty basic monitor, though, with limited on-screen help and a somewhat difficult interface.
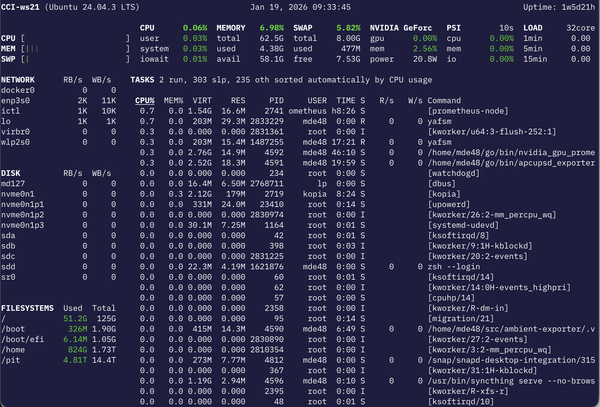
htop is a straight enhancement of top, with colors, on-screen function key references, mouse support (you can click on a column header to it), etc. It’s frequently installed, and is pretty good if you only need to monitor basic CPU, memory, and I/O resources.
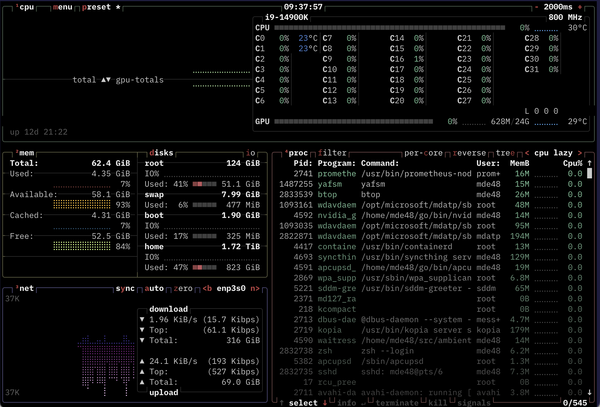
btop provides some richer at-a-glance information with a display that differs more from classic top. Importantly, though, it can report GPU utilization, which htop cannot. It is also pretty resource-efficient.
glances is a very information-dense display with a lot of configurability in terms of the resources it can monitor. However, it is very CPU-intensive to run — I usually have seen it consuming about 25% of a CPU just to refresh every 1–3 seconds.
Since I like Glances a lot, but don’t want my monitor using that much CPU, I wrote yafsm (Yet Another Fine System Monitor), which is modeled after Glances but has none of its configurability and is missing a lot of other features. It does solve the job of giving me a very quick display of system behavior, and uses NVML to show Nvidia GPU utilization.
If you are using a Linux desktop, both Gnome and KDE provide system monitors.
macOS
On macOS, the Activity Monitor is the system-provide system monitor, and it’s fine. top is also available, and htop can be installed through Homebrew, but htop doesn’t have as many features on macOS as it does on Linux.
yafsm also works on macOS, but only with basic features.
Windows
On Windows, use the Task Manager or the Resource Monitor, both shipped with the operating system.
If you are using WSL2, it appears in the task manager as a single process, the virtual machine running Linux. If you want to see your Linux processes, use a Linux system monitor within a WSL2 terminal.